Figure 3
Pyridostigmine-Induced Status Epilepticus Rat Model Was Resistant to Increasing Doses of Ramipril: The Latter Triggered Epileptogenesis, Arrhythmia, and Cardiac Ischemia in a Dose-Dependent Manner
Sherine Abdelmissih*, Monica Gamal and Kerollos M Naeem
Published: 20 March, 2025 | Volume 9 - Issue 1 | Pages: 010-027
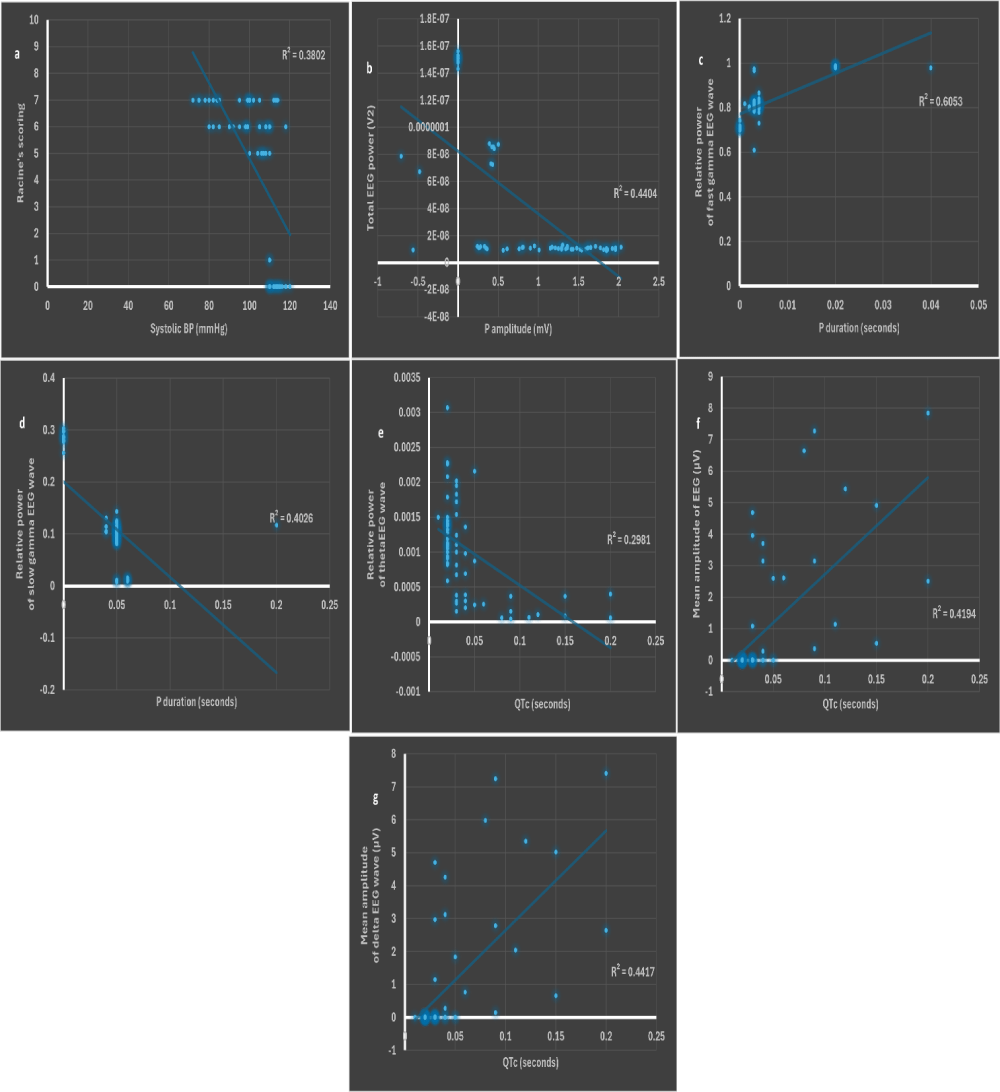
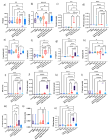
Figure 3:
Scatter plots of a. systolic BP (mmHg) and Racine’s scoring. b. P amplitude (mV) and total power of source EEG wave (V2). c. P duration (seconds) and relative power of fast gamma EEG wave. d. P duration (seconds) and relative power of slow gamma EEG wave. e. QTc (seconds) and relative power of theta EEG wave. f. QTc (seconds) and mean amplitude of source EEG wave (µV). g. QTc (seconds) and mean amplitude of delta EEG wave (µV). BP: blood pressure. p ˂ 0.05 is considered statistically significant. * r > 0.6 is considered as strong.
Read Full Article HTML DOI: 10.29328/journal.jnnd.1001106 Cite this Article Read Full Article PDF
More Images
Similar Articles
-
Do genes matter in sleep?-A comprehensive updateRajib Dutta*. Do genes matter in sleep?-A comprehensive update. . 2020 doi: 10.29328/journal.jnnd.1001029; 4: 014-023
-
Impact of mandibular advancement device in quantitative electroencephalogram and sleep quality in mild to severe obstructive sleep apneaCuspineda-Bravo ER*,García- Menéndez M,Castro-Batista F,Barquín-García SM,Cadelo-Casado D,Rodríguez AJ,Sharkey KM. Impact of mandibular advancement device in quantitative electroencephalogram and sleep quality in mild to severe obstructive sleep apnea. . 2020 doi: 10.29328/journal.jnnd.1001041; 4: 088-098
-
Cerebral arterial air embolism with anterior spinal cord syndrome after CT-guided hook-wire localization of Lung mass and pulmonary noduleNoor Sameh Darwich*,Umran Ugur,Mark P Anstadt,J Pedoto. Cerebral arterial air embolism with anterior spinal cord syndrome after CT-guided hook-wire localization of Lung mass and pulmonary nodule. . 2021 doi: 10.29328/journal.jnnd.1001044; 5: 006-015
-
Cortical spreading depolarizations in the context of subarachnoid hemorrhage and the role of ketamineLeandro Custódio do Amaral*. Cortical spreading depolarizations in the context of subarachnoid hemorrhage and the role of ketamine. . 2021 doi: 10.29328/journal.jnnd.1001045; 5: 016-021
-
Update in the Understanding, Diagnosis, and Management of Sturge Weber Syndrome: Case ReportMariana Catalina Garcini Sandoval*, Enrique Espinosa Zúñiga, Martha Guadalupe García Toribio. Update in the Understanding, Diagnosis, and Management of Sturge Weber Syndrome: Case Report. . 2023 doi: 10.29328/journal.jnnd.1001080; 7: 061-064
-
The Potential Use of Dimethyltryptamine against Ischemia-reperfusion Injury of the BrainAttila Kovacs, Anna Mathe, Ede Frecska*. The Potential Use of Dimethyltryptamine against Ischemia-reperfusion Injury of the Brain. . 2024 doi: 10.29328/journal.jnnd.1001097; 8: 050-056
-
Pyridostigmine-Induced Status Epilepticus Rat Model Was Resistant to Increasing Doses of Ramipril: The Latter Triggered Epileptogenesis, Arrhythmia, and Cardiac Ischemia in a Dose-Dependent MannerSherine Abdelmissih*,Monica Gamal,Kerollos M Naeem. Pyridostigmine-Induced Status Epilepticus Rat Model Was Resistant to Increasing Doses of Ramipril: The Latter Triggered Epileptogenesis, Arrhythmia, and Cardiac Ischemia in a Dose-Dependent Manner. . 2025 doi: 10.29328/journal.jnnd.1001106; 9: 010-027
Recently Viewed
-
Sinonasal Myxoma Extending into the Orbit in a 4-Year Old: A Case PresentationJulian A Purrinos*, Ramzi Younis. Sinonasal Myxoma Extending into the Orbit in a 4-Year Old: A Case Presentation. Arch Case Rep. 2024: doi: 10.29328/journal.acr.1001099; 8: 075-077
-
The relationship between IT consumption and anxiety in Pakistani youthWaqar Husain*,Sehrish Mobeen. The relationship between IT consumption and anxiety in Pakistani youth. Arch Psychiatr Ment Health. 2020: doi: 10.29328/journal.apmh.1001026; 4: 084-086
-
A Gecko-eye View of Naturalistic EnclosuresVictoria Davies, Abigail Heaman, James Brereton*. A Gecko-eye View of Naturalistic Enclosures. Insights Biol Med. 2023: doi: 10.29328/journal.ibm.1001026; 7: 013-019
-
Success, Survival and Prognostic Factors in Implant Prosthesis: Experimental StudyEpifania Ettore*, Pietrantonio Maria, Christian Nunziata, Ausiello Pietro. Success, Survival and Prognostic Factors in Implant Prosthesis: Experimental Study. J Oral Health Craniofac Sci. 2023: doi: 10.29328/journal.johcs.1001045; 8: 024-028
-
Bleeding from Varices: Still a Heavy Burden in Patients with CirrhosisAmitrano L*, Guardascione MA, Saviano S, Martino A, Lombardi G. Bleeding from Varices: Still a Heavy Burden in Patients with Cirrhosis. Ann Clin Gastroenterol Hepatol. 2023: doi: 10.29328/journal.acgh.1001043; 7: 035-037
Most Viewed
-
Evaluation of Biostimulants Based on Recovered Protein Hydrolysates from Animal By-products as Plant Growth EnhancersH Pérez-Aguilar*, M Lacruz-Asaro, F Arán-Ais. Evaluation of Biostimulants Based on Recovered Protein Hydrolysates from Animal By-products as Plant Growth Enhancers. J Plant Sci Phytopathol. 2023 doi: 10.29328/journal.jpsp.1001104; 7: 042-047
-
Sinonasal Myxoma Extending into the Orbit in a 4-Year Old: A Case PresentationJulian A Purrinos*, Ramzi Younis. Sinonasal Myxoma Extending into the Orbit in a 4-Year Old: A Case Presentation. Arch Case Rep. 2024 doi: 10.29328/journal.acr.1001099; 8: 075-077
-
Feasibility study of magnetic sensing for detecting single-neuron action potentialsDenis Tonini,Kai Wu,Renata Saha,Jian-Ping Wang*. Feasibility study of magnetic sensing for detecting single-neuron action potentials. Ann Biomed Sci Eng. 2022 doi: 10.29328/journal.abse.1001018; 6: 019-029
-
Pediatric Dysgerminoma: Unveiling a Rare Ovarian TumorFaten Limaiem*, Khalil Saffar, Ahmed Halouani. Pediatric Dysgerminoma: Unveiling a Rare Ovarian Tumor. Arch Case Rep. 2024 doi: 10.29328/journal.acr.1001087; 8: 010-013
-
Physical activity can change the physiological and psychological circumstances during COVID-19 pandemic: A narrative reviewKhashayar Maroufi*. Physical activity can change the physiological and psychological circumstances during COVID-19 pandemic: A narrative review. J Sports Med Ther. 2021 doi: 10.29328/journal.jsmt.1001051; 6: 001-007

HSPI: We're glad you're here. Please click "create a new Query" if you are a new visitor to our website and need further information from us.
If you are already a member of our network and need to keep track of any developments regarding a question you have already submitted, click "take me to my Query."


