Figure 1
Focal Ab-amyloid deposition precedes cerebral microbleeds and Superficial siderosis: a case report
Parnesh Raniga, Patricia Desmond, Paul Yates, Olivier Salvado, Pierrick Bourgeat, Jurgen Fripp, Svetlana Pejoska, Michael Woodward, Colin L Masters, Christopher C Rowe and Victor L Villemagne*
Published: 13 October, 2017 | Volume 1 - Issue 1 | Pages: 039-044

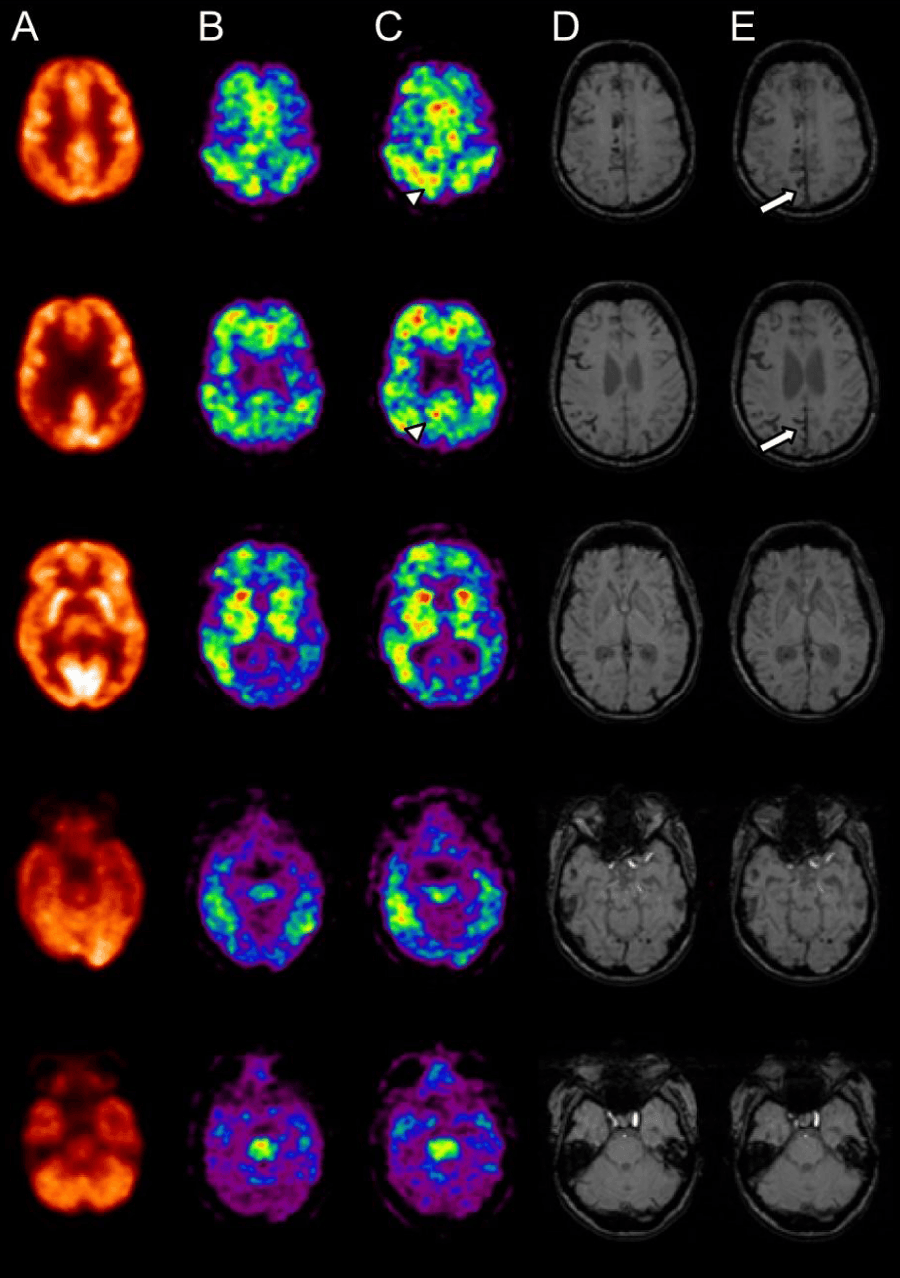
Figure 1:
Representative PET-MRI coregistered images showing extent of glucose hypometabolism (a: Sept 2005); focal Ab deposition as measured by PiB (b: March 2006 and c: July 2007) and extension of MH and SS as measured by MRI SWI (d: August 2007 and e: April 2009). Follow up MRI SWI (April 2009 (e)) shows new MH (white arrows) in those regions shown to have focal Ab deposition (PiB PET July 2007(c)) (arrow heads).
Read Full Article HTML DOI: 10.29328/journal.jnnd.1001007 Cite this Article Read Full Article PDF
More Images
Similar Articles
-
Lateralized Cerebral Amyloid Angiopathy presenting with recurrent Lacunar Ischemic StrokeYi Li*, Ayman Al-Salaimeh,Elizabeth DeGrush,Majaz Moonis*. Lateralized Cerebral Amyloid Angiopathy presenting with recurrent Lacunar Ischemic Stroke. . 2017 doi: 10.29328/journal.jnnd.1001005; 1: 029-032
-
Focal Ab-amyloid deposition precedes cerebral microbleeds and Superficial siderosis: a case reportParnesh Raniga,Patricia Desmond, Paul Yates,Olivier Salvado, Pierrick Bourgeat,Jurgen Fripp,Svetlana Pejoska, Michael Woodward,Colin L Masters,Christopher C Rowe,Victor L Villemagne*. Focal Ab-amyloid deposition precedes cerebral microbleeds and Superficial siderosis: a case report. . 2017 doi: 10.29328/journal.jnnd.1001007; 1: 039-044
-
Vigour of CRISPR/Cas9 Gene Editing in Alzheimer’s DiseaseJes Paul*. Vigour of CRISPR/Cas9 Gene Editing in Alzheimer’s Disease. . 2018 doi: 10.29328/journal.jnnd.1001014; 2: 047-051
-
Protection from the Pathogenesis of Neurodegenerative Disorders, including Alzheimer’s Disease, Amyotrophic Lateral Sclerosis, Huntington’s Disease, and Parkinson’s Diseases, through the Mitigation of Reactive Oxygen SpeciesSamskruthi Madireddy*,Sahithi Madireddy. Protection from the Pathogenesis of Neurodegenerative Disorders, including Alzheimer’s Disease, Amyotrophic Lateral Sclerosis, Huntington’s Disease, and Parkinson’s Diseases, through the Mitigation of Reactive Oxygen Species. . 2019 doi: 10.29328/journal.jnnd.1001026; 3: 148-161
-
Sexual Dimorphism in the Length of the Corpus Callosum in CadaverShahnaj Pervin*,Nasaruddin A,Irfan M,Annamalai L. Sexual Dimorphism in the Length of the Corpus Callosum in Cadaver. . 2024 doi: 10.29328/journal.jnnd.1001104; 8: 126-129
Recently Viewed
-
Sinonasal Myxoma Extending into the Orbit in a 4-Year Old: A Case PresentationJulian A Purrinos*, Ramzi Younis. Sinonasal Myxoma Extending into the Orbit in a 4-Year Old: A Case Presentation. Arch Case Rep. 2024: doi: 10.29328/journal.acr.1001099; 8: 075-077
-
Timing of cardiac surgery and other intervention among children with congenital heart disease: A review articleChinawa JM*,Adiele KD,Ujunwa FA,Onukwuli VO,Arodiwe I,Chinawa AT,Obidike EO,Chukwu BF. Timing of cardiac surgery and other intervention among children with congenital heart disease: A review article. J Cardiol Cardiovasc Med. 2019: doi: 10.29328/journal.jccm.1001047; 4: 094-099
-
Advancing Forensic Approaches to Human Trafficking: The Role of Dental IdentificationAiswarya GR*. Advancing Forensic Approaches to Human Trafficking: The Role of Dental Identification. J Forensic Sci Res. 2025: doi: 10.29328/journal.jfsr.1001076; 9: 025-028
-
Scientific Analysis of Eucharistic Miracles: Importance of a Standardization in EvaluationKelly Kearse*,Frank Ligaj. Scientific Analysis of Eucharistic Miracles: Importance of a Standardization in Evaluation. J Forensic Sci Res. 2024: doi: 10.29328/journal.jfsr.1001068; 8: 078-088
-
Toxicity and Phytochemical Analysis of Five Medicinal PlantsJohnson-Ajinwo Okiemute Rosa*, Nyodee, Dummene Godwin. Toxicity and Phytochemical Analysis of Five Medicinal Plants. Arch Pharm Pharma Sci. 2024: doi: 10.29328/journal.apps.1001054; 8: 029-040
Most Viewed
-
Evaluation of Biostimulants Based on Recovered Protein Hydrolysates from Animal By-products as Plant Growth EnhancersH Pérez-Aguilar*, M Lacruz-Asaro, F Arán-Ais. Evaluation of Biostimulants Based on Recovered Protein Hydrolysates from Animal By-products as Plant Growth Enhancers. J Plant Sci Phytopathol. 2023 doi: 10.29328/journal.jpsp.1001104; 7: 042-047
-
Sinonasal Myxoma Extending into the Orbit in a 4-Year Old: A Case PresentationJulian A Purrinos*, Ramzi Younis. Sinonasal Myxoma Extending into the Orbit in a 4-Year Old: A Case Presentation. Arch Case Rep. 2024 doi: 10.29328/journal.acr.1001099; 8: 075-077
-
Feasibility study of magnetic sensing for detecting single-neuron action potentialsDenis Tonini,Kai Wu,Renata Saha,Jian-Ping Wang*. Feasibility study of magnetic sensing for detecting single-neuron action potentials. Ann Biomed Sci Eng. 2022 doi: 10.29328/journal.abse.1001018; 6: 019-029
-
Pediatric Dysgerminoma: Unveiling a Rare Ovarian TumorFaten Limaiem*, Khalil Saffar, Ahmed Halouani. Pediatric Dysgerminoma: Unveiling a Rare Ovarian Tumor. Arch Case Rep. 2024 doi: 10.29328/journal.acr.1001087; 8: 010-013
-
Physical activity can change the physiological and psychological circumstances during COVID-19 pandemic: A narrative reviewKhashayar Maroufi*. Physical activity can change the physiological and psychological circumstances during COVID-19 pandemic: A narrative review. J Sports Med Ther. 2021 doi: 10.29328/journal.jsmt.1001051; 6: 001-007

HSPI: We're glad you're here. Please click "create a new Query" if you are a new visitor to our website and need further information from us.
If you are already a member of our network and need to keep track of any developments regarding a question you have already submitted, click "take me to my Query."


